Overview
Do You Even Run Bruh is a personal hybrid fitness tracking web application. The project grew through two major releases to become an online tool that continuously syncs data from two different apps and creates data visualization solutions that are not currently available from any competing products.

Development
This project began as a data processing tool to migrate data from one tracking app to another. Further iterations developed it into a tool for visualizing weight training and long-distance running activities from two separate spreadsheets side-by-side. The first release focused predominantly on comparing and contrasting efforts in each sphere to prove the hypothesis that progress and losses made in one pursuit are at the expense of the other. The next major version accepted this trade-off and focused less on highlighting the cost/benefit and instead emphasizes maintaining balance by promoting steady improvement (or maintenance) in both activities.
Problem this app solves (Solution Space)
Currently, no apps exist that excel at tracking both running and weight training. While some running apps include simple workout logging tools, and some strength logging apps include functionality for logging cardio activities, each treats the other as a second-class citizen. When running apps track strength training, it is without the workout creating tools standard in gym apps. Similarly, when gym workout log apps include cardio activities, it is without the summary statistics relevant to runners.
The lack of crossover may be user-driven—perhaps serious runners don’t lift, and serious lifters don’t run—but running apps and gym apps exist in very different market spaces. Large companies dominate the running app market. These companies tend to either be venture-backed (Strava, Runkeeper) or have marketing synergy interests through their primary investments being in physical products for the space (Adidas, Nike, Under Armour, Garmin). Conversely, the gym tracker app market comprises many more small startups or even single-owner businesses. (There also exists a third space for fitness apps such as Apple Fitness and Peleton, but these are media streaming platforms and not tracking apps.)
Regardless of the driver of division in the marketplace, the result is that anyone who wants to be half-serious about both running and working out needs to use two different apps—making it impossible to observe activities in a single calendar view and track progress holistically. To that end, this project provides a single calendar view for both activity types and a space for the relevant progress metrics for both disciplines to be viewed in a single app.

Design
The underlying value promoted by the app design is 'personal improvement'. Design decisions emphasize records, averages, streaks, and trends data—concepts that inspire internal challenge-driven behavior.
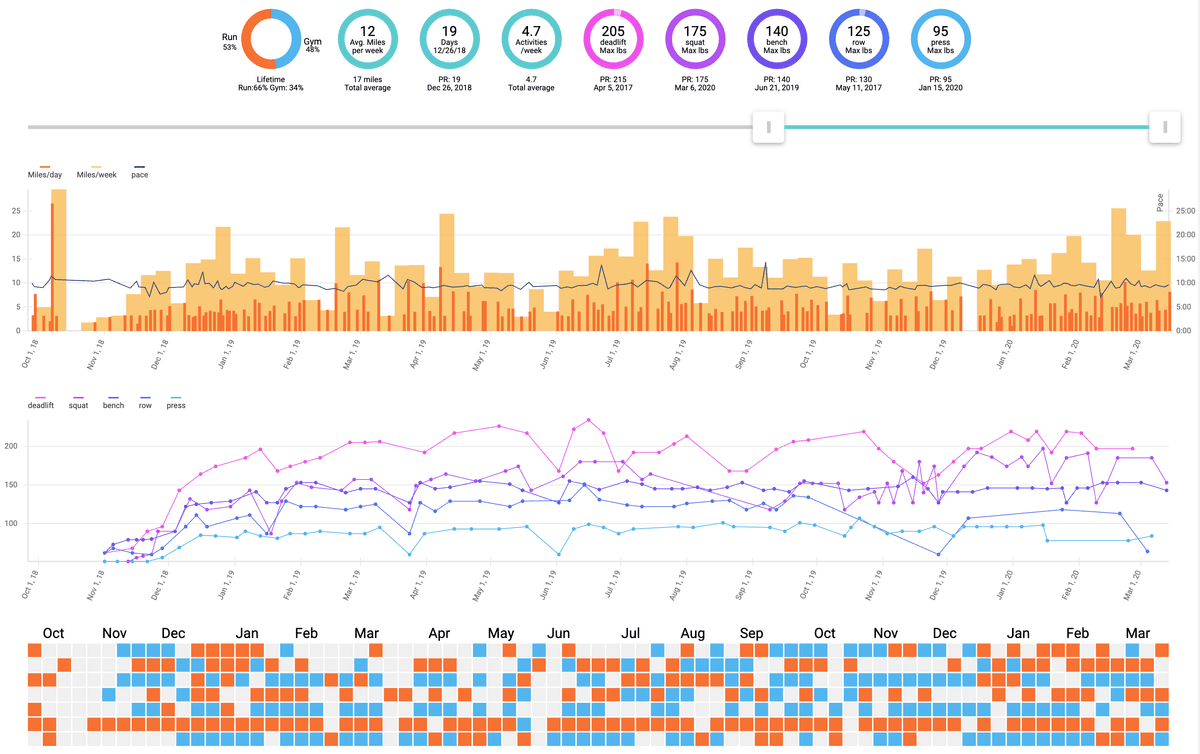
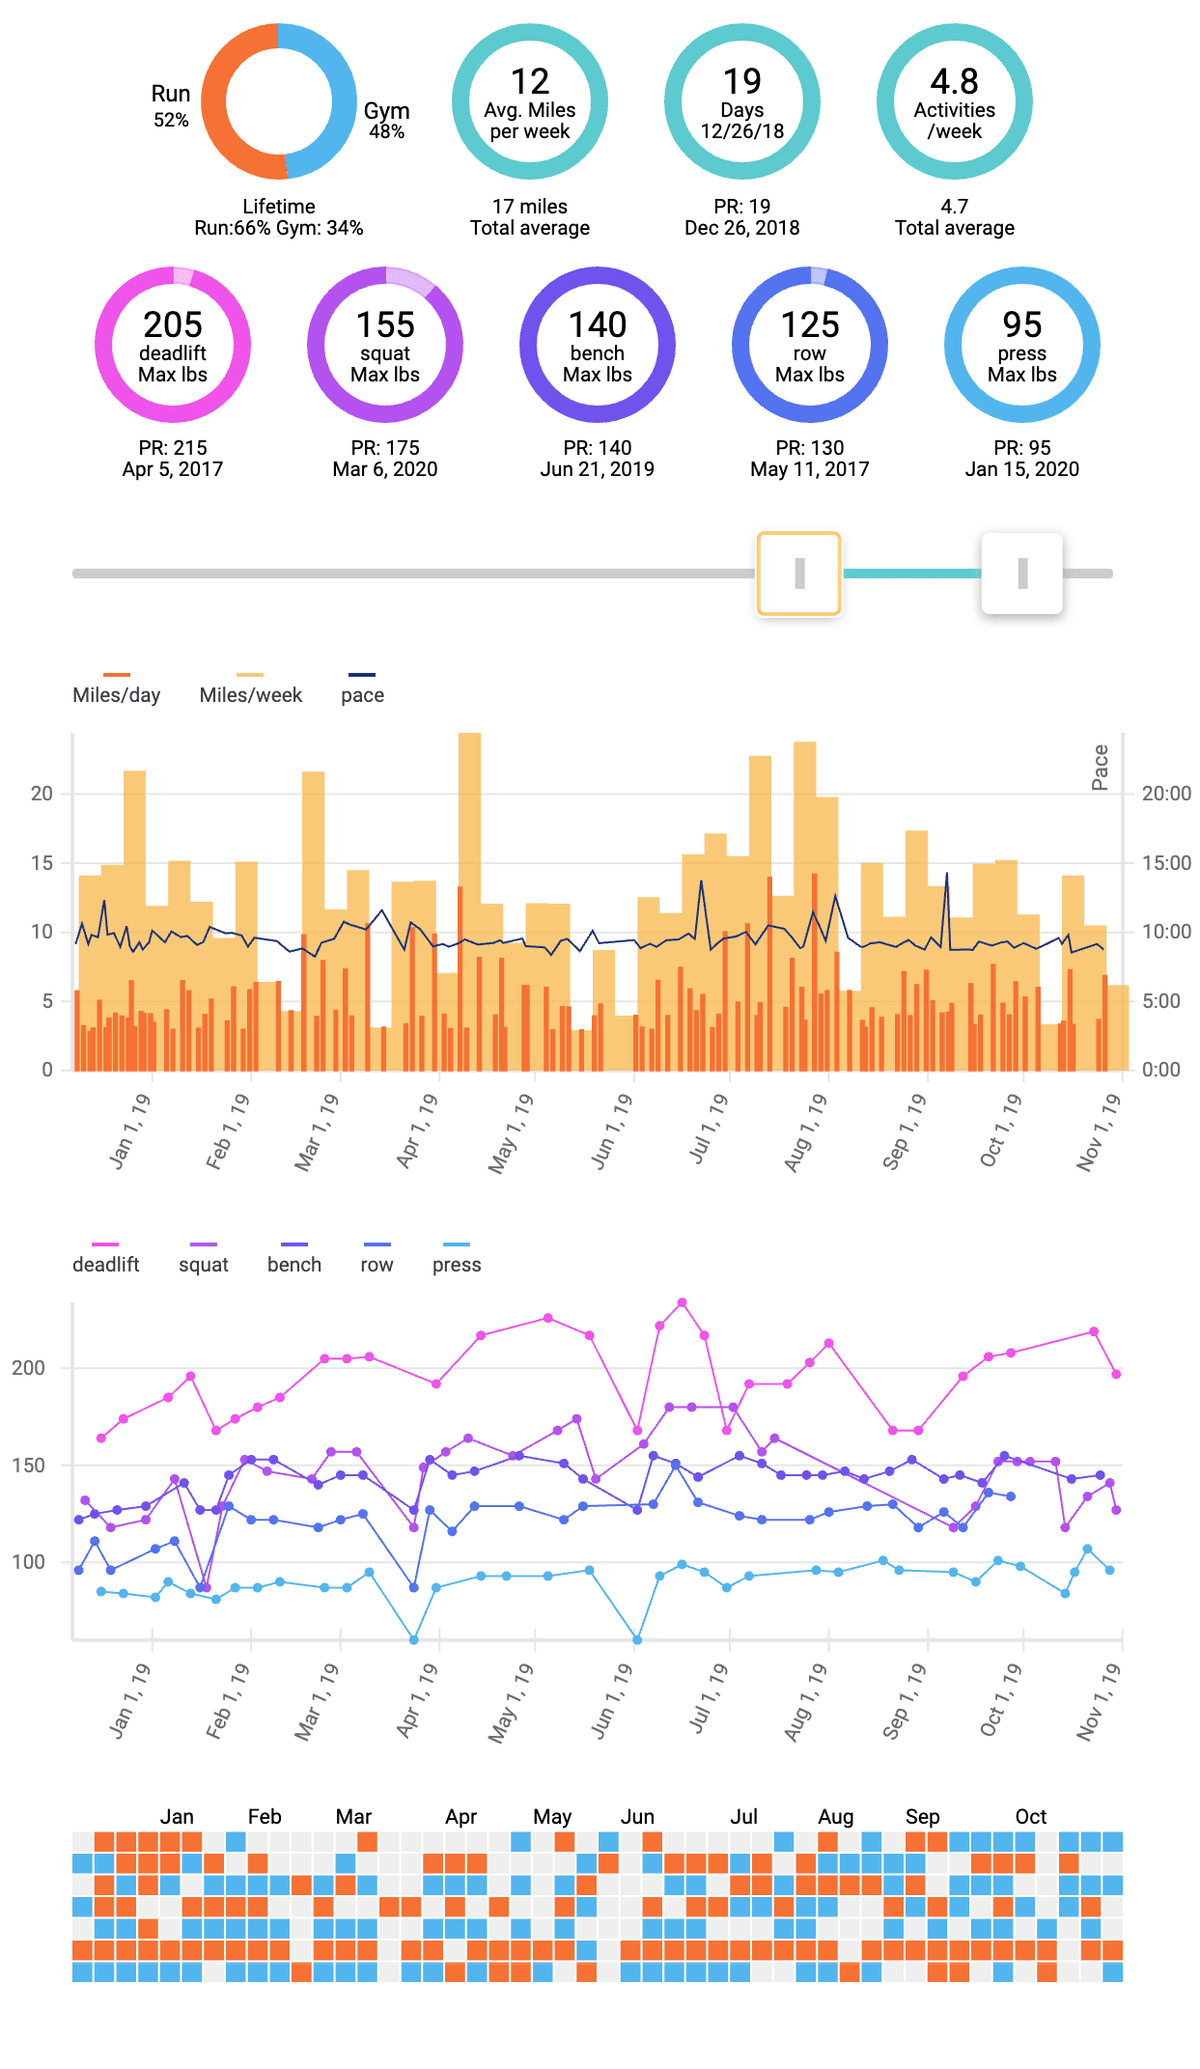
Users interact with the app by using a date range slider. Adjusting the slider pans and scales charts and changes the data displayed to reflect the selected time period.
Personal records (PR) for running and strength training activities are arranged prominently across the top. PR values adjust to display values based on the user-selected date range. While other apps (both running and fitness) maintain personal records, this app differs by presenting PRs within a user-defined time period. The standard model assumes users are on a constant improvement track, whereas in reality, a PR set four years ago is no longer relevant nor motivating. This design allows users to filter into narrower and more recent date ranges to find goals for which to strive.
Another feature distinguishing this app design from other systems is the combined data graphs. For running, weekly totals, daily runs, and average speed display in a single chart. This compact design highlights the relationship between metrics and facilitates comparing effects each has on one another. Similarly, the gym tracking section combines the primary exercises into one graph. This view provides insight into both overall fitness improvements, as well discrepancies in progress between individual exercises.
The primary distinguisher between this app and on-market solutions, however, and the core problem this app set out to solve is having both gym exercises and runs tracked in the same view. Stacking both graphs with their date x-axes aligned makes it apparent when crossing a threshold in one activity drastically reduces performance in the other. Additionally, the time axes also align with a color-coded calendar along the bottom. Through color, the calendar aids in visualizing trends in activity focus frequency. This feature has positive effects in motivating balance and in maintaining streaks.

Tech-stack
The current interaction of the app is built using React.js and relies heavily on react-vis to create the graphs. The earlier iteration was built in vanilla js and rendered the visualizations using d3.js.
Data for the app collects from two sources. Running data is recorded in Strava and automatically syncs the data into a Google Sheet using uses IFTTT. Gym data is collected using a mobile app that can export its data as a CSV. A custom script on android automatically syncs exports with a second Google Sheet. The then fetches data from each of these Sheets through a publish feature in Google.
Postmortem
External factors have led to the sunsetting of this project. A change in Google Sheets hosting has blocked it from being used as a data source (CORS errors) in its current manner. This problem is solvable, in fact, the way data was queried in the first iteration still works. Less solvable, however, is that the 2020 COVID pandemic has closed gyms across the country, and without that data source, there is no point in maintaining the project.
